Please note: “India’s population forecast provided in the United Nations Population Fund (UNFPA) State of World Population report [2023] is an estimate since there has been no census in the country since 2011. After 140 years of uninterrupted census every 10 years, the 2021 census was cancelled because of Covid and postponed to 2022. Now it has been pushed back again to 2024.” – BBC News Delhi (19 April 2023) https://www.bbc.co.uk/news/world-asia-india-65320690 >>
Read or download the complete backup document (PDF, 1,7 MB)
For information on the “Population of Particularly Vulnerable Tribal Groups (PTGs) in India from 1961 to 2001”, please refer to p. 16
- Table 1.1 State wise Scheduled Tribe population and decadal change by residence : 2011 (TOTAL) – see PDF for details
- Table 1.2 All India Population and Total ST Population – Male&Female (Census 2011) – see PDF for details
- Table 1.3 All India Population and Total ST Population – Male&Female …Rural (Census 2011) – see PDF for details
- Table 1.4 All India Population and Total ST Population –Male&Female …Urban (Census 2011) – see PDF for details
- Table 1.5. State wise Scheduled Tribe population by sex and residence : Census 2011 – see PDF for details
- Table 1.6 State wise Sex Ratio among Scheduled Tribes by residence : 2001 – 2011 – see PDF for details
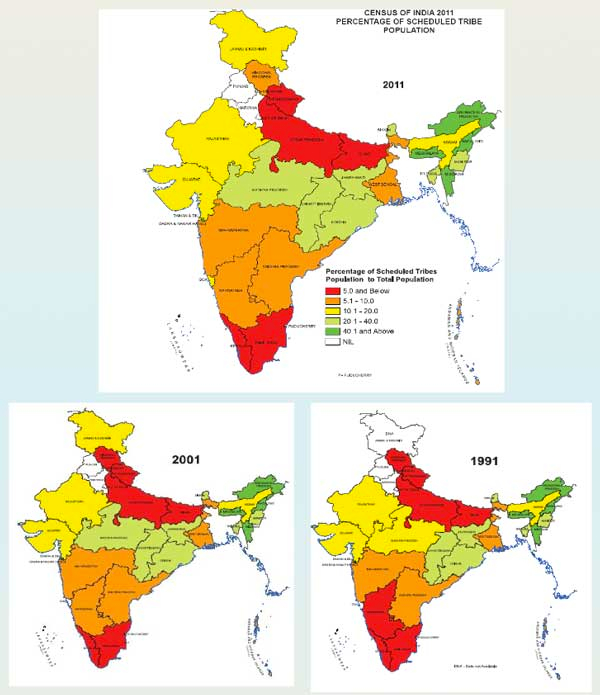
- Table 1.7 State wise Percentage of Scheduled Tribes to total population : 2001-2011 – see PDF for details
- Table 1.8 Scheduled Tribe population and decadal change by residence: PERSONS – see PDF for details
- State wise no. of district where the ST population is more than 50% and between 25% to 50 percent as per Census 2011 – see PDF for details
- List of districts where the ST population is more than 50% – see PDF for details
- List of districts where the ST population is between 25% to 50% – see PDF for details
- Population of Particularly Vulnerable Tribal Groups (PTGs)in India from 1961 to 2001 (Figures in actual) – see PDF for details
Tribes with more than 5 Lakh [o,5 million] of Population as per census 2001
- Bhil [~12,7 million]
- Gond [~10,8 million]
- Santal [~5,8 million]
- Mina [~3.8 million]
- Naikda etc. [~3,3 million]
- Oraon [~3,1 million]
- Sugalis [~2,1 million]
- Munda [~1,9 million]
- Naga etc. [~1,8 million]
- Khond [~1,4 million]
- Boro etc. [~1,3 million]
- Koli Mahadev [1,2~ million]
- Khasi etc. [~1,1 million]
- Warli [~1,1 million]
- Ho [~0,8 million]
- Gujjar [~0,7 million]
- Korku [~0,7 million]
- Bhumji [~0,7 million]
- Garo [~0,7 million]
- Koya [~0,7 million]
- Mizo [~0,7 million]
- Rathwa [~0,5 million]
- Saharia [~0,5 million]
Source: “Demographic Status of Scheduled Tribe Population of India”, Government of India, file: 201306110208002203443DemographicStatusofScheduledTribePopulationofIndia.pdf
Address: http://www.tribal.nic.in/WriteReadData/CMS/Documents
Date Visited: Wed Jan 06 2016 15:48:18 GMT+0100 (CET)
Indigenous people represent only about six percent of the world’s population, but they inhabit around a quarter of the world’s land surface. And they share these regions with a hugely disproportionate array of plant and animal life. According to the UN and the World Bank, about 80 percent of our planet’s biodiversity is on land where indigenous people live.
“There is a need to explore the tribal consciousness in the backdrop of climate change, development, and deforestation.” – Deepanwita Gita Niyogi in “India’s Adivasi Identity in Crisis” Pulitzer Center May 27, 2021 | Learn more about climate change and illegal mining | United Nations on climate change | Find free publications on India’s hunter-gatherers in the Unesco Digital Library >>
What is caused (and not caused) by climate change?
How data can help fight a growing tendency by politicians and journalists to overstate the role of climate change| Learn more or listen here >>
Find publications by reputed authors (add “open access” for freely downloadable content)
Find up-to-date information provided by, for and about Indian authors, researchers, officials, and educators
List of web portals covered by the present Custom search engine
Ashoka Trust for Research in Ecology and the Environment (ATREE) – www.atree.org
Freedom United – www.freedomunited.org
Government of India (all websites ending on “.gov.in”)
Kalpavriksh Environmental Action Group – https://kalpavriksh.org
Shodhganga (a reservoir of Indian theses) – https://shodhganga.inflibnet.ac.in
Survival International – www.survivalinternational.org
UCLA Digital Library – https://digital.library.ucla.edu
Unesco – https://en.unesco.org
Unesco digital library – https://unesdoc.unesco.org
Unicef – www.unicef.org
United Nations – www.un.org/en
Video Volunteers – www.videovolunteers.org
WorldCat (“the world’s largest library catalog, helping you find library materials online”) – https://worldcat.org
To search Indian periodicals, magazines, web portals and other sources safely, click here. To find publishing details for Shodhganga’s PhD search results, click here >>
Search tips
Combine the name of any particular state, language or region with that of any tribal (Adivasi) community.
Add keywords of special interest (music, poetry, dance just as health, sacred grove and biodiversity); learn about the rights of Scheduled Tribes such as the “Forest Rights Act” (FRA); and the United Nations “Declaration on the Rights of Indigenous Peoples”, “Universal Declaration of Human Rights”, “women’s rights”, or “children’s right to education”.
Ask a question that includes “tribal” or “Adivasi”, for instance: “Adivasi way of life better?” (or “tribal way of life worse?”)
Specify any particular issue or news item (biodiversity, bonded labour and human trafficking, climate change, ecology, economic development, ethnobotany, ethnomedicine, global warming, hunter-gatherers in a particular region or state, prevention of rural poverty, water access).
For official figures include “scheduled tribe ST” along with a union state or region: e.g. “Chhattisgarh ST community”, “Himalayan tribe”, “Scheduled tribe Tamil Nadu census”, “ST Kerala census”, “Particularly Vulnerable Tribal Group Jharkhand”, “PVTG Rajasthan”, “Adivasi ST Kerala”, “Adibasi ST West Bengal” etc.
In case the Google Custom Search window is not displayed here try the following: (1) toggle between “Reader” and regular viewing; (2) in your browser’s Security settings select “Enable JavaScript” | More tips >>
Note: hyperlinks and quotes are meant for fact-checking and information purposes only | Disclaimer >>
Some clarifications on caste-related issues by reputed scholars >>
See also
Adverse inclusion | Casteism | Rural poverty
Childhood | Tribal Children’s Right to Education in India
Demographic Status of Scheduled Tribe Population of India (Census figures 2011)
Fact checking | Figures, census and other statistics
Human Rights Commission (posts) | www.nhrc.nic.in (Government of India)
Search tips | Names of tribal communities, regions and states of India
“What is the Forest Rights Act about?” – Campaign for Survival and Dignity
“Who are Scheduled Tribes?” – Government of India (National Commission for Scheduled Tribes, NCST)